Go to the U of M home page

Thursday, September 20, 2012

Spring 2012 Data

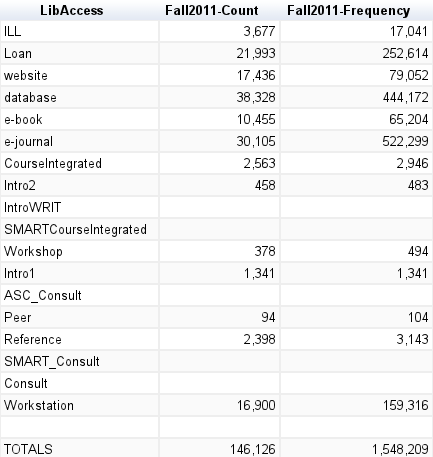
Hello everyone! It has been a long time, but we finally have data and information to share concerning our continued efforts around this project. We finally have Spring 2012 data to share! But first, let's take a look back at the raw data from Fall 2011:


So, in the library access areas we measured there were 146,126 Internet IDs (61,195 unique) captured at the frequency of 1,548,209 transactions. With this data, we found that 77% of undergrads made use of the library during the Fall 2011 semester and 85% of grad students.


Now let's take a look at Spring 2012:


In the Spring 2012 semester, we captured 1,646,836 transactions, almost 100,000 more than in the Fall 2011 semester. As might be expected, the increase in usage was mainly seen in website, database, and e-journal usage.

You'll also note that we attempted to count transactions in more library access categories such as students who take our introduction to libraries instruction through their Writing course, or students that had a consultation with our Archives and Special Collections department. These new library access points did not have a huge impact on our overall numbers, but they are nice to have to compare and to determine who uses these services the most.

One thing this chart does not list is the number of unique Internet IDs captured in the Spring 2012 semester. That number is 59,722. So, slightly less unique Internet IDs in the Spring 2012 semester than in the Fall. Some of that difference can certainly be attributed to student graduation and attrition. In fact, from Fall to Spring we saw 43,015 returning users and 16,707 new users. Some of those new users were most certainly new undergrads and grad students just starting at the U of M in January.

In the next few days we will write some entries regarding the demographics of this Spring 2012 data, namely who are these students and what colleges and majors are represented. But as a little teaser, what we have found out so far is that 78% of undergrads used the library in Spring 2012. That is one percentage point higher than Fall 2011. 87% of graduate students made use of the library in Spring 2012. That is two percentage points higher than Fall 2011.

More to come soon!

Friday, June 29, 2012

Evidence of Impact

I was signing up for an ELI webinar when I noticed this on the EDUCAUSE site--

"Seeking Evidence of Impact (SEI) is a program lead by the ELI community to find current effective practices that would enable the collection of evidence to help faculty and administration make decisions about best practices to adopt, invest their time, effort and fiscal resources in....We hope to bring all types of higher education institutions and professional associations into a conversation on this theme. We envision an inclusive discussion that includes faculty members, instructional support professionals, librarians, students, and research experts in a collaborative exchange of insights and ideas."

http://www.educause.edu/eli/programs-and-resources

Have any libraries been part of this so far?

As I was reading this over I like the mention of "making decisions." Sometimes I feel our need to collect data makes us lose sight of the reasons and next steps. For my concrete brain...the data collection and analysis should hopefully should be driven by decision making. I also think this organization (EDUCAUSE/ELI) is doing some great work on behalf of Libraries. I think many users lump the Libraries into the broad category of "technology" even if that isn't necessarily how we see ourselves.


Monday, June 18, 2012

Good for you?

walden.jpgI tripped across this reference to some of our work on the blog for the Walden University Library...love the title Is Using The Library Good For You? Yes!

I have been thinking of ways to share our results with new students during our efforts at Orientation and this might hit the right note.

Read at: http://www.waldenlibrarynews.com/blog/2012/6/13/is-using-the-library-good-for-you-yes.html

Friday, June 8, 2012

Gathering Reference Statistics a Balance of Privacy

As mentioned earlier, reference is one of the high touch, possibly high impact services. Reference is an area of great privacy concern. How do you gather reference statistics? We started with the low hanging fruit, which also was the least intrusive, chat reference.

Like many institutions, the University of Minnesota uses QuestionPoint for chat and e-mail reference. When a patron poses a question via chat, the inclusion of their e-mail address is not required, and using their designated University of Minnesota e-mail is not specified. However, at least we have some data to use. Many other institutions use services such as Meebo, which use anonymous chat patron handles, making gathering data much more difficult. QuestionPoint transactions are accessible for only 90 days, which means we need to go in and retrieve the data at numerous points during the semester.

How do we gather in-person reference transaction statistics without impeding privacy and maintaining a welcoming atmosphere? Please post suggestions in the comments below.

Friday, June 1, 2012

High touch services

We are working on gathering data for spring and I am struck again on how challenging it presentation.jpgis to gather meaningful statistics on some of our core services--reference/consultation and instruction.

These are high-touch and potentially some of the highest impact services we provide but our data collections techniques are almost non-existant for these face to face interactions.

What we did in Fall....
For Reference we gathered email and chat transations from Questionpoint--the software we use to facilitate these services.
BUT...
-email addresses aren't required
-U of M email address aren't required
-no data on desk transactions in any location
-no data on consultations or small group sessions with librarians

For Instruction we gathered our workshop *registrations* and we gathered *class lists* of courses who had a one-short/guest lecture sort of session.
BUT...
-not matched up with actual attendance or any last minute drop-ins
-missing entire classes due to confusion over section, professor, etc.
-missing non-course session (e.g. dept. orientation sessions, clinical groups, etc.)
-challenging to make multiple sessions obvious in reports

Bottom line: We are missing tens of thousands of interactions and uses of our libraries.

So...I have been asking myself....

  • Can we ask students to swipe with each session or consultation or question at the desk?
  • How do we adequately reflect this high touch, nuanced interactions?
  • How do demonstrate the range of activities in these categries (from 5 minute interaction to multiple session class time or hour long consultation)?


Do you have any ideas?

An addendum to NSSE

We hope to learn more about this effort and determine how other existing assessments can be overlaid (is that the right word?) with our own efforts...

nsse.jpg
At ALA in Anaheim in June....

Title: Feasible, Scalable, and Measurable: Information Literacy Assessment & the National Survey of Student Engagement (NSSE)
Date: Monday, June 25, 2012, Time: 8-10:00 a.m., Location: ACC-203A

Description: While academic libraries struggle with assessing efforts to improve students' information skills, few assessment opportunities offer longitudinal and comparative data regarding information literacy. NSSE, a leading postsecondary assessment survey, has collaborated with librarians to create the Information Literacy Module, an addendum to the survey. The module is designed to facilitate efforts to assess undergraduates' information literacy and compare their results to other institutions. NSSE researchers and librarians will provide an overview of NSSE and the module, suggest methods to incorporate NSSE data into assessment efforts, and invite participant feedback to improve the information literacy module.

Outcomes:
Participants will be introduced to the draft survey questions for the NSSE information literacy module
Participants will learn how to incorporate NSSE data into their assessment efforts
Participants will have an opportunity to ask questions and provide feedback regarding the module's content

Presenters:
Polly Boruff-Jones (Drury University)
Carrie Donovan (Indiana University Libraries)
Kevin Fosnacht (NSSE)

Friday, May 25, 2012

Pre-Demographic Results

When we began work on the Library Data and Student Success project, we knew that we'd need to combine the data we collected with demographic and performance data tracked by the Office of Institutional Research (OIR). But even before we matched students with their library use, we were having fun with the numbers.

To recap, we collected U of M Internet IDs from 13 different service and resource areas during the Fall 2011 semester. Each of these 13 datasets has its own set of caveats regarding exactly what we can capture. For example, if a librarian has an instruction session with a particular class, anyone registered for that class is counted as receiving Course-Integrated Librarian Instruction. We have no way of knowing which students were in the room that day, so we're most likely over-counting in that area. On the flip side, reference staff don't typically log the patron's Internet ID in an in-person reference transaction, and the ID is sometimes not included even in an online transaction, so reference interactions are most likely under-counted.

With those caveats in mind, we set about doing what analysis we could while we waited for the OIR analysts to perform their magic. We added each of the 13 datasets to a Microsoft Access database as a table. Each table consisted of a list of Internet IDs. Using just these tables, we were able to determine the answers to questions like these:

  • How many individuals interacted with the Libraries in any measurable way?

  • How many interactions of each type did each individual have?

  • What was the total number of interactions of each type?

  • How many different types of interactions did an individual have with the Libraries?

  • How many individuals who did one thing (were registered for a course with course-integrated library instruction, for example) also did another (checked out a book)?


These questions were addressed and answered in aggregate, but having the Internet ID in each log allowed us to separate individuals from interactions. Here are some of the tidbits we were able to calculate:

  • 61,195 individuals used the Libraries in some measurable way in Fall 2011.

  • 10,455 people accessed an e-book, and 21,993 checked out or renewed at least one item.

  • 38,328 people used a database, and 30,105 accessed an e-journal.

  • 23,807 people used only one of the 13 service and resource areas. 2,774 used six or more.

  • 47,197 people used some type of digital resource (database, website, e-journal, or e-book) for a total of 1,110,727 digital interactions.